

Part 1 – The Surprising Wealth of Taiwan
Taiwan has become synonymous with the international trade in semiconductors. Modern life is today literally “Made in Taiwan” and the rest of the world has slowly woken up to this fact.
What may be less widely appreciated internationally is the extent of the vast fortune that has accumulated here from more than four decades of uninterrupted trade surpluses. Taiwan’s wealth is built upon foundations laid down not only by dazzling recent success but also by an enviable ability to remain competitive as a manufacturing exporter over the long term.
The following is an exploration of how Taiwan grows and manages its incredible wealth. We will discover how this bounty has been deployed internationally via a unique and complex financial system that is nonetheless underappreciated beyond these shores. Along the way we will also become more familiar with some of the major financial institutions that call this island home.
Attempting to put Taiwan into its rightful context, we shall see that this Asian Tiger is not only one of the world’s most dynamic exporting superpowers: it is also, somewhat secretly, one of the wealthiest places on Earth.
The most important company in the world?
The driving force behind Taiwan’s outsized impact on international trade today can in large part be attributed to the efforts of one remarkable organization. Much admiring ink has already been spilt in the business media1 over the meteoric rise of Taiwan Semiconductor Manufacturing Company (TSMC) in recent years. A peerless global trailblazer, this leviathan pioneered the pure-play foundry model and is now responsible for producing the lion’s share of the most advanced Integrated Chips on the planet2.
The rewards for such foresight and innovation are plain to see. TSMC now ranks among the top ten most valuable companies on Earth. No other listed company in East Asia is more valuable – China’s Tencent, South Korea’s Samsung and Japan’s Toyota are all dwarfed by the Taiwanese champion3.
Fellow premier-league companies that rely heavily on TSMC to enable their high-tech products include even bigger titans by market value, such as Apple and Nvidia4. From smartphones to AI and from automobiles to 5G base stations, it is both surprising and somewhat sobering to discover that a single institution plays such a vital role in facilitating so many aspects of our modernity.
It is no exaggeration then to state that TSMC is an irreplaceable element within many of the global supply chains that feed humanity’s insatiable demand for technology products.
Obscured by the shadow of a giant
So enormous is this firm that its gravitational field distorts the topography of Taiwan’s capital markets. Using average market capitalization data for the month of April 2023, TSMC alone accounts for 26.8% of the total market value of the nearly 1,000 Listed Companies quoted on the main Taiwan Stock Exchange (TWSE)5.
This naturally impacts any comparisons between the 28 broad market sectors defined by the TWSE. The following calculations are again based on April 2023 average market capitalization data. New Taiwan Dollar values are converted to USD at the average rate for April6. The top five TWSE sectors for April 2023 were:
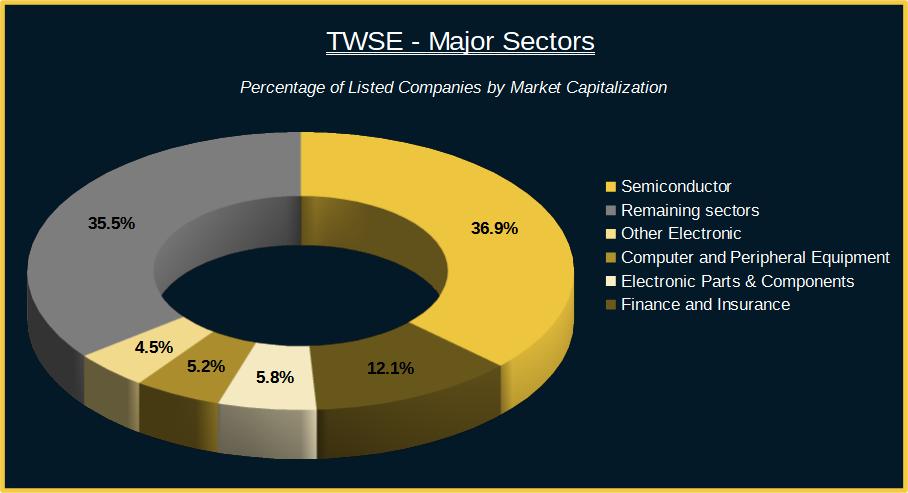
If we zoom in on the Semiconductor sector and then break out the value of TSMC from the rest of the group, we can easily appreciate the outsize contribution of the company:
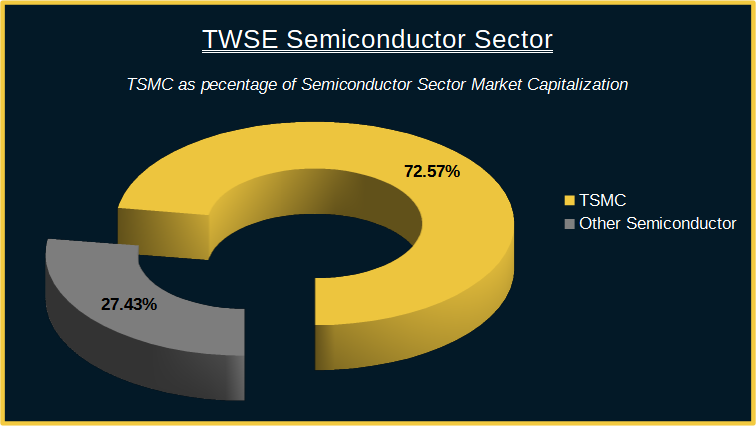
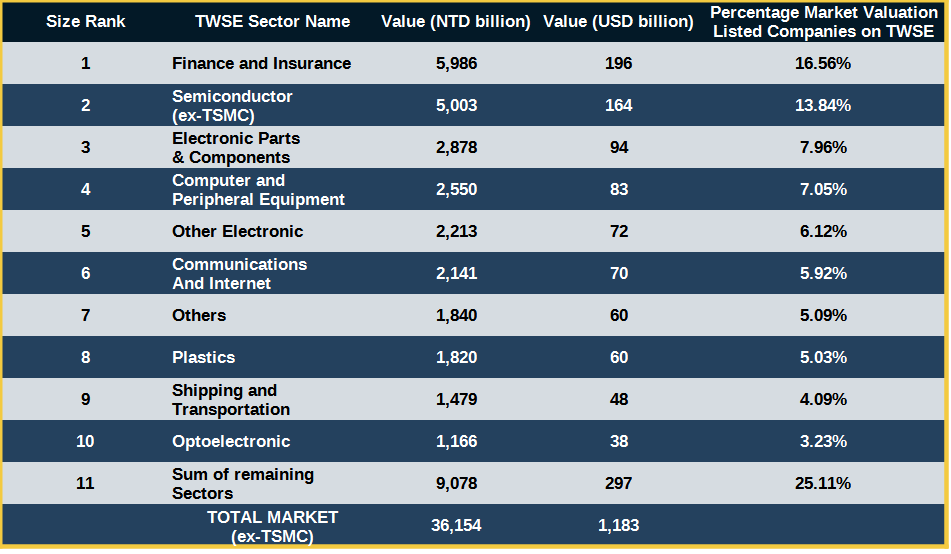
The five leading sectors account for almost two-thirds of the market value of Taiwan’s largest listed companies. But what would this list look like if we removed the exceptional outlier that is TSMC from the data? Under such a scenario the Finance and Insurance sector would easily seize pole position, with Semiconductor relegated to a distant second place at an adjusted USD 164 billion valuation.
At least two major insights can be gleaned from this simple exercise. The most obvious of these is the overwhelming influence that TSMC exerts on the overall trajectory of Taiwan’s stock market performance. It is quite literally impossible for professional asset managers to invest in Taiwan without very careful consideration of exactly how much capital to allocate to this one security. Strategies benchmarked either to TWSE’s flagship TAIEX index or to MSCI’s Taiwan Index (popular with overseas investors) often live or die by this decision alone.
Putting TSMC to one side, our second major insight is that Taiwan’s Finance and Insurance sector cannot be underestimated. Stepping out from the shadow of TSMC, the magnitude of Taiwan’s Financial Services sector becomes immediately apparent. By value, Taiwan has the 4th most important Financial sector in all of the Asia Pacific region7.
This island’s ecosystem of Financial Holding Companies, Banks and Insurers is even more remarkable given a relative lack of internationalization. Few of the financial players familiar to us here would be recognizable outside of their immediate environs. And yet Taiwan’s financial institutions collectively control investments worth trillions of US dollars, a not insignificant amount of which is deployed overseas.
Let us now proceed to draw back the curtain further on the nature of the fabulous wealth of Taiwan.
Getting rich, staying rich
To understand why Finance is such a dominant sector of the Taiwanese economy, we first need to discuss the drivers of this island’s phenomenal wealth. With an incredibly successful export-driven economy, it is perhaps unsurprising that a population of fewer than 24 million should punch above its weight financially. However, a more complete analysis reveals that the full extent of Taiwan’s Financial exceptionalism is quite astonishing.
The following data are from the IMF8,9.
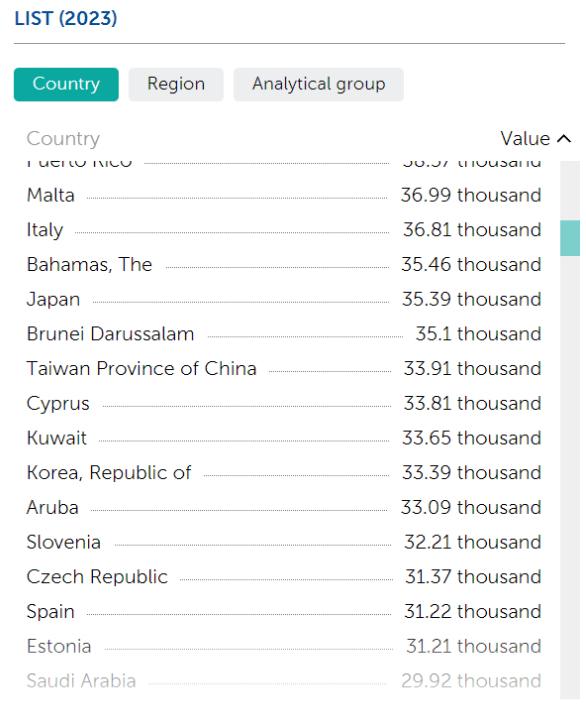
In terms of wealth, Taiwan’s GDP per capita places it among the World’s richest nations. The IMF’s World Economic Outlook (nominal) estimate for 2023 has Taiwan (USD 33,910) just above South Korea (USD 33,390) and within sight of Japan (USD 35,390). However, a more meaningful expression of the prosperity of the Taiwanese is to be found when we examine the same IMF data at Purchasing Power Parity (PPP).
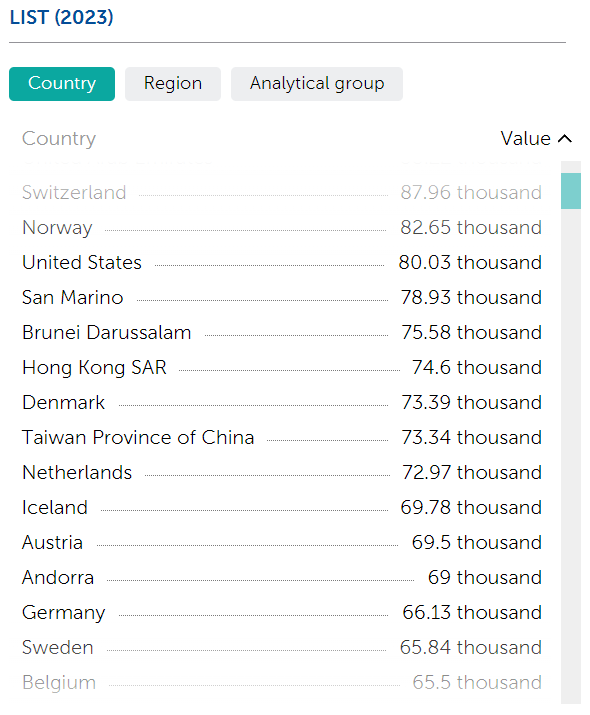
The IMF reveals that, in PPP terms, Taiwan is the 12th richest country in the World (excluding the regions of Hong Kong and Macao), with a GDP per head of USD 73,344 projected for 2023. Within the Asia-Pacific region, only the tiny states of Singapore and Brunei rank above this economic powerhouse on a per capita basis. My own homeland of the United Kingdom lags far behind in a somewhat disappointing 29th place.
The source of this prosperity is in some part driven by ongoing achievements in international trade. A second, less well-publicized source of this bounty lies within the massive portfolio of overseas and domestic investments into which Taiwan has steadily funnelled its historical trade surpluses over the decades. Although there are many other factors that contribute to the wealth of a nation, it is these two that really set Taiwan apart. Let’s briefly look into the first of these.
An export powerhouse
Preliminary data from the National Statistical Bureau show that exports accounted for almost 72% of GDP in 2022 and averaged 69.33% over the two decades between 2002 and 2021. Imports were 59% of GDP in 2022 and averaged 60.71% between 2002 and 2021.10
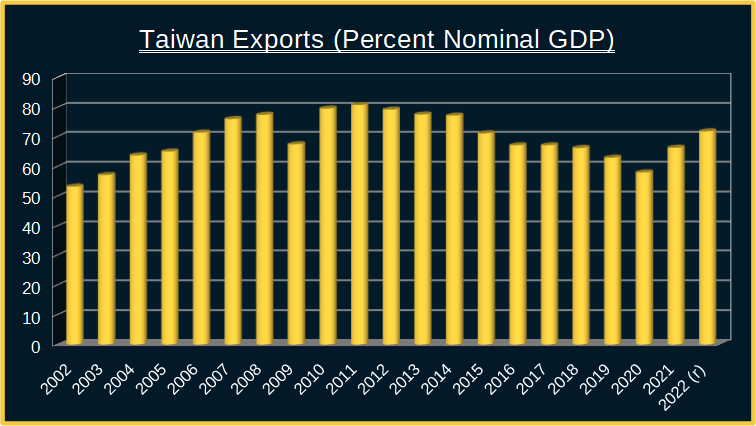
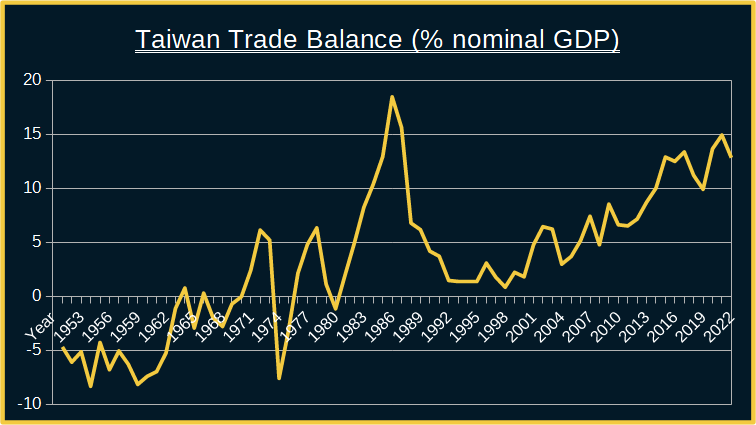
It is easy to see from the above figures that this island racked up a trade surplus of around 13% of GDP for 2022. Indeed, Taiwan has enjoyed a trade surplus for 42 years, with the last annual trade deficit recorded in 1980.10
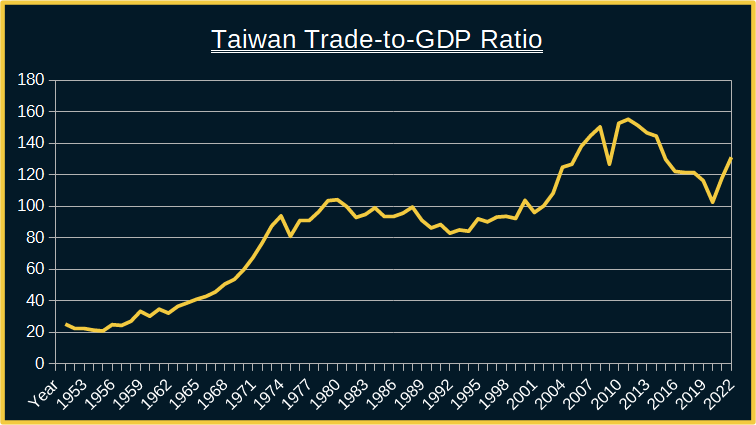
An accessible way to measure the total impact of trade on an economy is the trade-to-GDP ratio, which is a simple sum of the value of exports and imports expressed as a percentage of GDP for a specific period. In 2022, total trade accounted for 131% of the total economic output of the island.10
But what do all these statistics mean? Unfortunately, it is sometimes hard to put the data from Taiwan into its proper global context. For example, the World Bank publishes national statistics on total exports and total imports as a percentage of GDP. As at the time of writing, the most recent data covers 167 countries and territories for the full year 202111. However, Taiwan is specifically excluded from World Bank datasets.
What would we discover if we included Taiwan’s 2021 statistics in this World Bank dataset? Where exactly does this tiger economy stand in terms of international trade? Let’s find out:
- In 2021, Taiwan’s exports were, by nominal US dollar value, the 20th most valuable in the world
- Taiwan would have ranked 12th out of 168 countries and territories in terms of its trade surplus in 2021. This places Taiwan well within the top 10% globally.
- Just to confirm Taiwan was not enjoying some unusually good fortune in 2021, the same comparison for the 5-year average trade surplus from 2017 to 2021 would place Taiwan once again 12th out of 168 countries and territories.
- Taiwan would have been the 33rd most exposed to international trade, as measured by the trade-to-GDP ratio in 2021.
- Calculating a trade-to-GDP ratio over the same 5-year period as bullet point 2, Taiwan would have risen to 32nd place out of 168.
Of course, the trading nations that are monitored by the World Bank specialize in producing different types of exports. The simplest classification for exports divides them broadly into two categories: goods and services. To add some useful granularity, goods are often separated further into two broad sub-types: commodities, which include raw materials and their simplest derivative products, and the outputs of various manufacturing processes. Using these categories, we may classify the exports of a trading nation as mostly comprising commodities, manufactured products, services or otherwise as some balanced blend of these three.
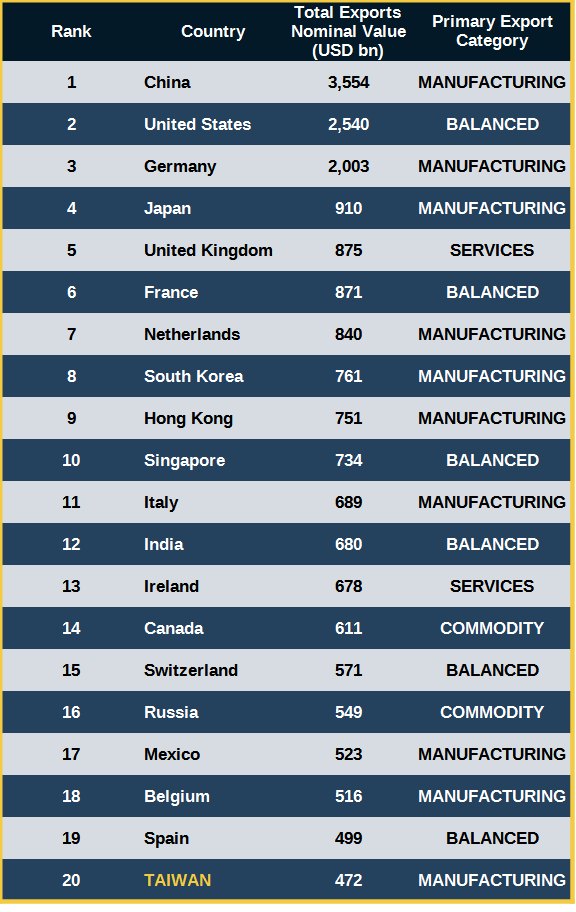
It is clear on an even cursory examination of exports by dollar value, that Manufacturing exporters took the prize in 2021. The extremely unusual circumstances surrounding the pandemic initially drove massive demand for computers and communication devices, as people confined to their homes sought escape and human connection in less perilous virtual worlds.
Re-opening then brought with it a spike in the demand for cars, with second-hand vehicles of dubious provenance commanding fanciful prices and waiting lists for new vehicles growing ever longer as shortages, most notably in computer chips, kept forcing delivery dates back further and further into the future.
Among the major exporters that rely heavily on manufactured products, Taiwan ranked a respectable 10th globally. Not a bad performance but perhaps a little disappointing, at least given this author’s earlier claims of Formosan exceptionalism. However, there is another prism through which to assess the trading success of a nation – the trade surplus.
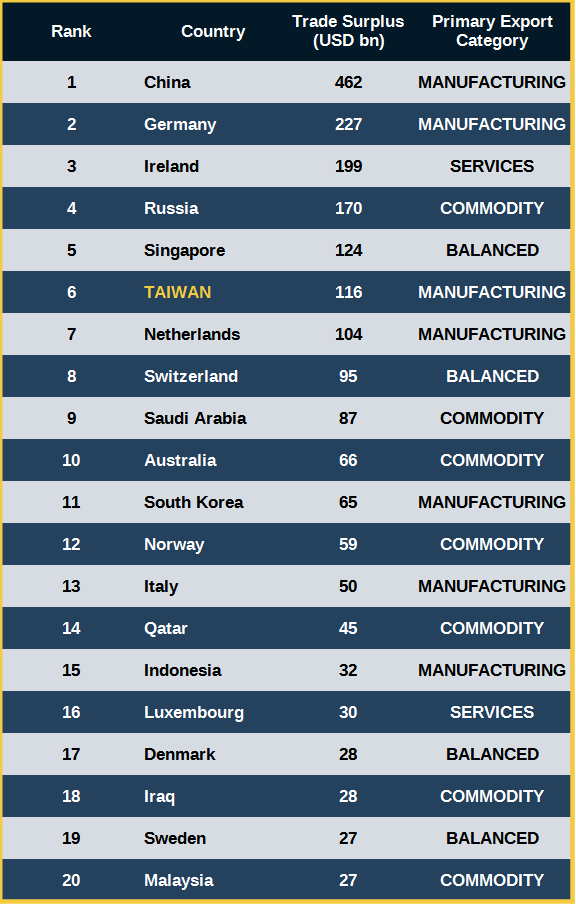
The table on the left above shows the US dollar value of the top twenty exporters with a trade surplus in 2021. Taiwan now places a more impressive sixth globally. Among the club of Manufacturing exporters, Taiwan’s performance is bested only by China and Germany. In a year when manufactured products dominated world trade, it is not surprising that some of the biggest winners specialized in these exports.
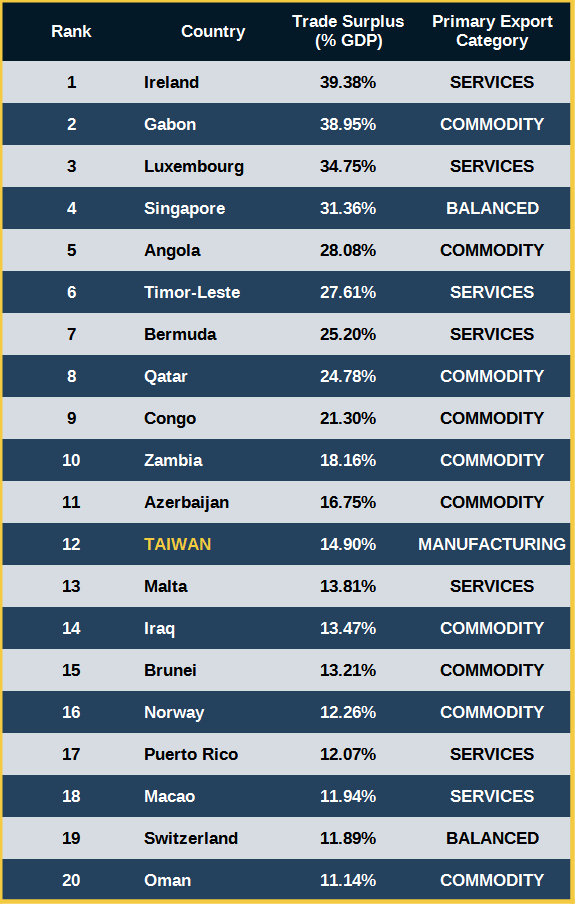
However, if we examine the list of exporters in the right-hand table, we find that the ranking by trade surplus expressed as a percentage of GDP paints a very different picture of success. It is plain to see from these data that exporting services and commodities can make for very “profitable” countries. Let’s briefly examine the countries that dominate this table to look for any similarities.
First note that many of the members of the elite club of service exporters represented here are centres for offshore finance. Ireland, Luxembourg, Singapore and Bermuda are each well-known to those operating in the world of international finance. Driven by favourable tax treatments and friendly regulatory environments, institutions specializing in asset management, reinsurance and private banking seek out these jurisdictions and disproportionate profit is often the result.
Exports of energy commodities are also a widely recognized source of national wealth, albeit one that is all too often associated with certain downsides. The wealth of many oil-exporting nations is as legendary as their propensity for political instability, brutal authoritarianism or both. Unsurprisingly, energy commodity exporters dominate the list here with Gabon, Angola, Qatar, Azerbaijan, Iraq, Brunei and Norway all benefitting from their natural endowments of hydrocarbons.
What is significant about this list however, is the distinct absence of the manufacturing exporters that dominated the table on the left. Except for one name. It’s the one we added back to the World Bank data set. It is Taiwan.
So here, then, is the smoking gun. Taiwan can in a loose sense be crowned the world’s most “profitable” manufacturing exporter. Despite being almost entirely dependent on imports for its energy needs, Taiwan generated more wealth via trade relative to its size than any nation on the planet in 2021. And it did so by a country mile. Recall, it achieved this feat while at the same time placing in the top twenty globally by value of exports.
Any accusations of hyperbole attracted by the title of this article having now been rendered moot, the next part of this series will delve into another major aspect of Taiwan’s exceptionalism: the astonishing value of its Net International Investment Position (NIIP).
Sources
1: See for example:
https://www.ft.com/content/bae9756a-3bce-4595-b6c9-8082fd735aa0
https://edition.cnn.com/2022/12/06/business/nightcap-tsmc-chip-plant-biden/index.html
https://time.com/6219318/tsmc-taiwan-the-center-of-the-world/
2:
https://www.taiwannews.com.tw/en/news/4475221
3:
https://companiesmarketcap.com/tsmc/marketcap/
4:
https://english.cw.com.tw/article/article.action?id=3417
5:
https://www.twse.com.tw/en/trading/statistics/list04-223.html
and author’s own calculations
6:
https://rate.bot.com.tw/xrt/quote/2023-04/USD
7:
Author’s calculations for total capitalization of Financial Services sectors in the APAC region at end April show that China (including Hong Kong), Japan and Australia (excluding LICs and ETFs) have greater total valuations than Taiwan. South Korea includes several chaebol with the majority of their revenue derived from outside of Finance-related activities in their “Other Financial” sector. With these chaebols stripped out, South Korea’s Financial Services sector becomes significantly smaller than Taiwan’s by value.
8:
https://www.imf.org/external/datamapper/NGDPDPC@WEO/OEMDC/ADVEC/WEOWORLD
9:
https://www.imf.org/external/datamapper/PPPPC@WEO/OEMDC/ADVEC/WEOWORLD
10:
https://eng.stat.gov.tw/News_Content.aspx?n=2336&s=230936
and author’s own calculations
11:
https://data.worldbank.org/indicator/NE.EXP.GNFS.ZS
and author’s own calculations
Leave a Reply